FEN Indicator Screenshots
Adjustable Inputs: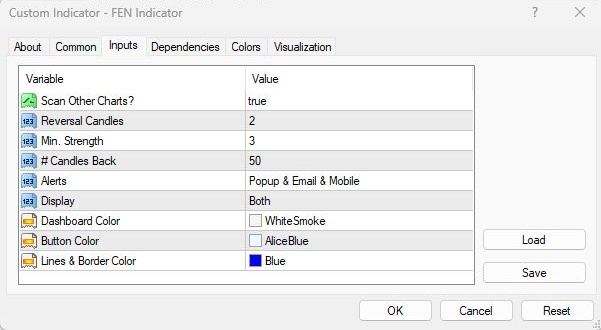
The indicator comes with adjustable and easy-to-understand settings. You can adjust chart scanning, signal sensitivity, alerts, display type, and display colors.
Display Example:
The FEN indicator displays a simple dashboard showing the information about the signal(s) and also a vertical line(s) set into the FUTURE. Both the dashboard and vertical lines can be enabled/disabled according to your preference. The colors are also adjustable.
What To Expect:
GBPUSD H1 (BEFORE) - The FEN indicator predicted a reversal for 2017.02.02 12:00. Now, look at the next image and see what happened at this time.

GBPUSD H1 (AFTER) - This is a perfect example of the power of this indicator. The market had been in an uptrend for many candles, but exactly on the predicted time, the trend changed. It actually resulted in the 1st candle of a new downtrend!
More Examples
For newer examples, you can view the FEN signals section on the forum. The below screenshots are older examples and were taken live using the broker FxChoice. They have not been updated in a while here simply because the indicator works the same now as it did years ago. To see the potential of our FEN Indicator yourself, just try the free DEMO version. It is available for instant download off the forum. No registration is required.
The vertical lines and times shown in the dashboard in the below screenshots were drawn by the FEN indicator. This is how the indicator visually shows the time of the FUTURE predictions. As clearly seen in the screenshots below, the predictions were produced well in advance. The FEN indicator predicts market reversals. Therefore, at the times predicted, the market should reverse and go in the opposite direction than how it had been moving prior to the predicted time. For example, if the market had been moving upwards (bullish) then a sell trade would be placed. And if the market had been moving downwards (bearish) then a buy order would be placed.
![]() Bitcoin H1 (BEFORE) - The FEN indicator predicted reversals for 2018.04.27 02:00, 2018.04.27 05:00, and 2018.04.27 20:00.
Bitcoin H1 (BEFORE) - The FEN indicator predicted reversals for 2018.04.27 02:00, 2018.04.27 05:00, and 2018.04.27 20:00.
![]() Bitcoin H1 (AFTER) - The 1st and 3rd predictions resulted in very nice tops. The 2nd prediction might have been skipped since market direction was unclear prior to the predicted time. However, if you had expected a reversal and placed a sell trade, it would have went in profit since the next candle was a long bearish candle.
Bitcoin H1 (AFTER) - The 1st and 3rd predictions resulted in very nice tops. The 2nd prediction might have been skipped since market direction was unclear prior to the predicted time. However, if you had expected a reversal and placed a sell trade, it would have went in profit since the next candle was a long bearish candle.
![]() Bitcoin H1 (BEFORE) - The FEN indicator predicted reversals for 2018.04.26 08:00.
Bitcoin H1 (BEFORE) - The FEN indicator predicted reversals for 2018.04.26 08:00.
![]() Bitcoin H1 (AFTER) - The market had been moving up prior to the predicted time, and then right on time, a top formed and the market reversed down.
Bitcoin H1 (AFTER) - The market had been moving up prior to the predicted time, and then right on time, a top formed and the market reversed down.
![]() EURJPY M30 (BEFORE) - The FEN indicator predicted reversals 2017.03.21 17:30 and 2017.03.21 21:00.
EURJPY M30 (BEFORE) - The FEN indicator predicted reversals 2017.03.21 17:30 and 2017.03.21 21:00.
![]() EURJPY M30 (AFTER) - The 1st prediction resulted in a nice bottom. The market had been moving down and then the market formed a bottom and reversed up. The 2nd prediction resulted in a top forming. The previous two candles were bullish and then the top formed and the market reversed downwards. Both predictions were successful.
EURJPY M30 (AFTER) - The 1st prediction resulted in a nice bottom. The market had been moving down and then the market formed a bottom and reversed up. The 2nd prediction resulted in a top forming. The previous two candles were bullish and then the top formed and the market reversed downwards. Both predictions were successful.
![]() GBPUSD H4 (BEFORE) - The FEN indicator predicted a reversal for 2017.02.09 16:00.
GBPUSD H4 (BEFORE) - The FEN indicator predicted a reversal for 2017.02.09 16:00.
![]() GBPUSD H4 (AFTER) - This is a great example showing the power of this indicator. The market had been moving up, but starting exactly at the predicted time, the market reversed down. You would have placed a sell order in this example. The move down was more than 100 pips and still going.
GBPUSD H4 (AFTER) - This is a great example showing the power of this indicator. The market had been moving up, but starting exactly at the predicted time, the market reversed down. You would have placed a sell order in this example. The move down was more than 100 pips and still going.
![]() GBPUSD M15 (BEFORE) - The FEN indicator predicted a reversal for 2017.01.19 22:00.
GBPUSD M15 (BEFORE) - The FEN indicator predicted a reversal for 2017.01.19 22:00.
![]() GBPUSD M15 (AFTER) - The market had been moving up and then a top formed at 2017.01.19 22:00 followed by a short reversal down.
GBPUSD M15 (AFTER) - The market had been moving up and then a top formed at 2017.01.19 22:00 followed by a short reversal down.
![]() GBPJPY M15 (BEFORE) - The FEN indicator predicted a reversal for 2017.01.13 05:00.
GBPJPY M15 (BEFORE) - The FEN indicator predicted a reversal for 2017.01.13 05:00.
![]() GBPJPY M15 (AFTER) - The market had been moving up and then at 2017.01.13 05:00 a top formed and the market reversed down.
GBPJPY M15 (AFTER) - The market had been moving up and then at 2017.01.13 05:00 a top formed and the market reversed down.
![]() USDJPY M15 (BEFORE) - The FEN indicator predicted a reversal for 2017.01.12 15:45.
USDJPY M15 (BEFORE) - The FEN indicator predicted a reversal for 2017.01.12 15:45.
![]() USDJPY M15 (AFTER) - At exactly 2017.01.12 15:45, a top formed and the market reversed down.
USDJPY M15 (AFTER) - At exactly 2017.01.12 15:45, a top formed and the market reversed down.
![]() NZDUSD H1 (BEFORE) - The FEN indicator predicted reversals for 2016.11.30 19:00, 2016.12.01 06:00, 2016.12.01 08:00, 2016.12.01 16:00.
NZDUSD H1 (BEFORE) - The FEN indicator predicted reversals for 2016.11.30 19:00, 2016.12.01 06:00, 2016.12.01 08:00, 2016.12.01 16:00.
![]() NZDUSD H1 (AFTER) - The market had been moving down prior to the first prediction. Then at 2016.11.30 19:00 the market reversed upwards right on time. For the 2nd prediction, the market was not moving in a clear direction, but the previous candle was slightly bearish. Then at 2016.12.01 06:00, the market reversed upwards. This is a good example of increased volatility which the indicator predicts in advance. For the 3rd prediction, the market had been bullish and then at 2016.12.01 08:00 a nice top formed and the market reversed down. For the 4th prediction, the market was not moving in a clear direction, but the previous candle was bullish. Then at 2016.12.01 16:00, the market reversed downwards. This is another example of increased volatility which the indicator predicts in advance.
NZDUSD H1 (AFTER) - The market had been moving down prior to the first prediction. Then at 2016.11.30 19:00 the market reversed upwards right on time. For the 2nd prediction, the market was not moving in a clear direction, but the previous candle was slightly bearish. Then at 2016.12.01 06:00, the market reversed upwards. This is a good example of increased volatility which the indicator predicts in advance. For the 3rd prediction, the market had been bullish and then at 2016.12.01 08:00 a nice top formed and the market reversed down. For the 4th prediction, the market was not moving in a clear direction, but the previous candle was bullish. Then at 2016.12.01 16:00, the market reversed downwards. This is another example of increased volatility which the indicator predicts in advance.
![]() EURUSD H4 (BEFORE) - The FEN indicator predicted a reversal for 2016.11.24 04:00.
EURUSD H4 (BEFORE) - The FEN indicator predicted a reversal for 2016.11.24 04:00.
![]() EURUSD H4 (AFTER) - The market had been moving down prior to 2016.11.24 04:00. The market reversed upwards right on time.
EURUSD H4 (AFTER) - The market had been moving down prior to 2016.11.24 04:00. The market reversed upwards right on time.
![]() EURUSD H1 (BEFORE) - The FEN indicator predicted a reversal for 2016.11.23 17:00.
EURUSD H1 (BEFORE) - The FEN indicator predicted a reversal for 2016.11.23 17:00.
![]() EURUSD H1 (AFTER) - The market had been moving down prior to the predicted time. A bottom formed at 2016.11.23 17:00 which was followed by a long trend up.
EURUSD H1 (AFTER) - The market had been moving down prior to the predicted time. A bottom formed at 2016.11.23 17:00 which was followed by a long trend up.
![]() GBPUSD H1 (BEFORE) - The FEN indicator predicted reversals for 2016.11.18 11:00 and 2016.11.18 18:00.
GBPUSD H1 (BEFORE) - The FEN indicator predicted reversals for 2016.11.18 11:00 and 2016.11.18 18:00.
![]() GBPUSD H1 (AFTER) - The 2016.11.18 11:00 prediction resulted in a 1 candle reversal. The market had been moving up and then the market reversed down right on time. The 2016.11.18 18:00 prediction resulted in great reversal. The market had been moving down strongly and then the market reversed up precisely on time.
GBPUSD H1 (AFTER) - The 2016.11.18 11:00 prediction resulted in a 1 candle reversal. The market had been moving up and then the market reversed down right on time. The 2016.11.18 18:00 prediction resulted in great reversal. The market had been moving down strongly and then the market reversed up precisely on time.
![]() USDJPY H1 (BEFORE) - The FEN indicator predicted a reversal for 2016.11.10 05:00.
USDJPY H1 (BEFORE) - The FEN indicator predicted a reversal for 2016.11.10 05:00.
![]() USDJPY H1 (AFTER) - The market had been bearish prior to the signal time. Then starting on 2016.11.10 05:00 the market reversed and turned bullish.
USDJPY H1 (AFTER) - The market had been bearish prior to the signal time. Then starting on 2016.11.10 05:00 the market reversed and turned bullish.
![]() EURJPY H4 (BEFORE) - The FEN indicator predicted a reversal for 2016.11.07 12:00.
EURJPY H4 (BEFORE) - The FEN indicator predicted a reversal for 2016.11.07 12:00.
![]() EURJPY H4 (AFTER) - The market had been bullish prior to the signal time. Exactly starting at 2016.11.07 12:00, the market reversed downwards.
EURJPY H4 (AFTER) - The market had been bullish prior to the signal time. Exactly starting at 2016.11.07 12:00, the market reversed downwards.
![]() EURJPY M15 (BEFORE) - The FEN indicator predicted reversals for 2016.11.02 23:30, 2016.11.03 02:45, 2016.11.03 03:15, and 2016.11.03 06:00.
EURJPY M15 (BEFORE) - The FEN indicator predicted reversals for 2016.11.02 23:30, 2016.11.03 02:45, 2016.11.03 03:15, and 2016.11.03 06:00.
![]() EURJPY M15 (AFTER) - The first prediction resulted in a bottom forming. The 2nd prediction resulted in a bottom forming after a strong move down. The 3rd prediction resulted in an entry that would have been very close to the top that formed. It would have had the potential to be a very profitable trade since the market dropped strongly immediately afterwards. The 4th prediction resulted in a bottom forming after the strong move down. This example shows how the signals can be used for both entries and exits!
EURJPY M15 (AFTER) - The first prediction resulted in a bottom forming. The 2nd prediction resulted in a bottom forming after a strong move down. The 3rd prediction resulted in an entry that would have been very close to the top that formed. It would have had the potential to be a very profitable trade since the market dropped strongly immediately afterwards. The 4th prediction resulted in a bottom forming after the strong move down. This example shows how the signals can be used for both entries and exits!
![]() NZDUSD H1 (BEFORE) - The FEN indicator predicted a reversal for 2016.11.02 16:00 and 2016.11.04 11:00.
NZDUSD H1 (BEFORE) - The FEN indicator predicted a reversal for 2016.11.02 16:00 and 2016.11.04 11:00.
![]() NZDUSD H1 (AFTER) - The market had been moving up prior to both signal times. Both predictions resulted in tops forming!
NZDUSD H1 (AFTER) - The market had been moving up prior to both signal times. Both predictions resulted in tops forming!
![]() EURUSD H1 (BEFORE) - The FEN indicator predicted a reversal for 2016.11.02 21:00.
EURUSD H1 (BEFORE) - The FEN indicator predicted a reversal for 2016.11.02 21:00.
![]() EURUSD H1 (AFTER) - The market had been moving down prior to the signal time. A bottom formed at 21:00 and then the market reversed upwards.
EURUSD H1 (AFTER) - The market had been moving down prior to the signal time. A bottom formed at 21:00 and then the market reversed upwards.
![]() NZDUSD H1 (BEFORE) - The FEN indicator predicted a reversal for 2016.11.04 11:00.
NZDUSD H1 (BEFORE) - The FEN indicator predicted a reversal for 2016.11.04 11:00.
![]() NZDUSD H1 (AFTER) - The market had been moving up prior to the predicted time. A top formed at 11:00 and the market moved downwards for 2 candles.
NZDUSD H1 (AFTER) - The market had been moving up prior to the predicted time. A top formed at 11:00 and the market moved downwards for 2 candles.